A money-making machine
For our last newsletter of 2017, we thought about a more generic but important topic to highlight the year that is about to pass and set the stage (and our mindset) forward to 2018 and beyond.
Since President Trump was elected in November 2016, we have not experienced anything close to a correction in the US sharemarket as well as our domestic market. It is easy to get carried away and believe that next year and every other year will deliver positive results. It is natural that after a good year, investor expectation about future returns tend to rise. While there are plenty of reasons to remain optimistic, in the shorter term we advise some caution and conservatism on next year’s returns. Over the very long term however, we are confident that the sharemarket is a “money-making machine.”
The below observation is courtesy of an advisory group in the UK on the importance of looking long term to deliver superior investment returns as demonstrated using the S&P 500 index in the United States.
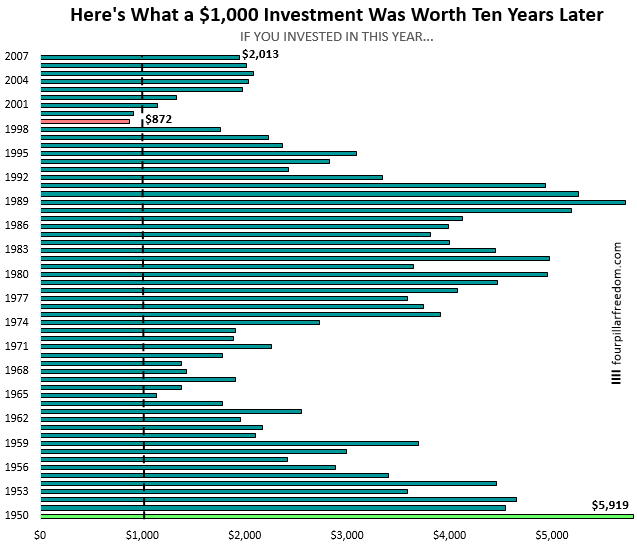
- In any rolling 10-year period since 1950, you would have made money in 56 of the 58 ten-year period.
- On average, the S&P 500 tripled in value over any 10-year period.
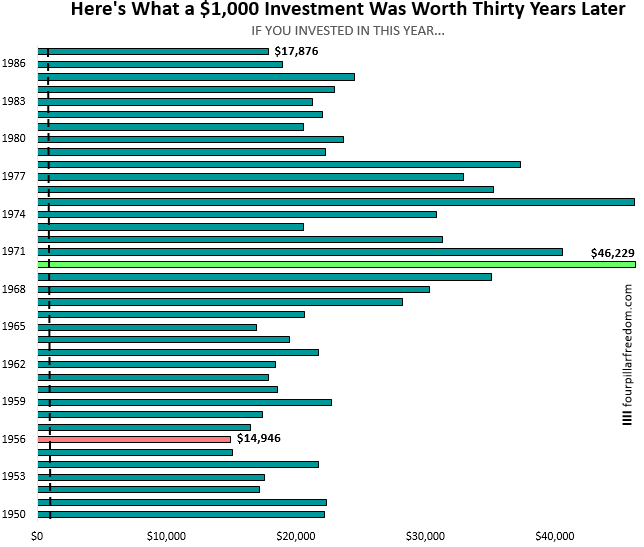
- Even using the worst 30-year period since 1950 the value of the index would have provided almost 15 times your money.

How to interpret this graph:
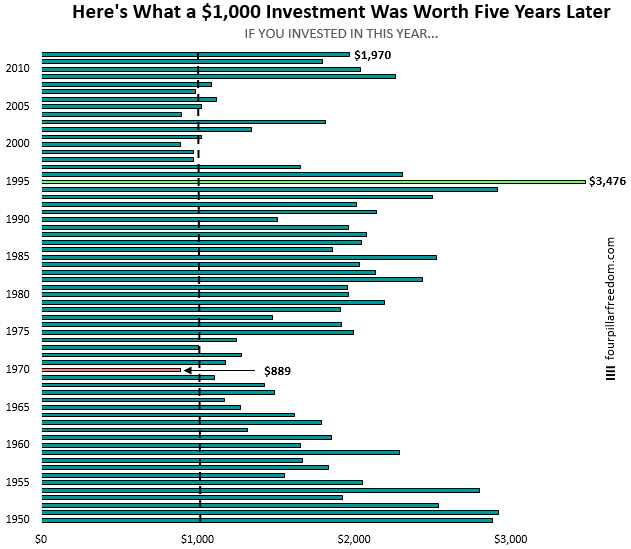
| Highest 5 year return: | A $1,000 investment in the S&P 500 in 1995 returned you $3,476 by the end of 1999 |
| Lowest 5 year return: | A $1,000 investment was worth $889 between 1970 and 1974 |
| Average 5 year return: | $1,777 |

How to interpret this graph:
| Highest 5 year return: | A $1,000 investment in the S&P 500 in 1950 returned you $5,919 by the end of 1959 |
| Lowest 5 year return: | A $1,000 investment was worth $889 between 1999 and 2008 |
| Average 5 year return: | $3,001 |

How to interpret this graph:
| Highest 5 year return: | A $1,000 investment in the S&P 500 in 1970 returned you $46,229 by the end of 1999 |
| Lowest 5 year return: | A $1,000 investment was worth $14,946 between 1956 and 1985 |
| Average 5 year return: | $24,478 |
In summary
Markets may fluctuate wildly during the course of the day, the month or the year and it is possible to lose money in the sharemarket, but over a long period of time, it is a known fact that the sharemarket will deliver a positive outcome for investors who stay invested and are able to stomach the short-term fluctuations.
Please feel free to discuss the above or any other financial matters you may have with your advisers.
Disclaimer: This publication has been compiled by Financial Decisions (AFSL/ACL Number 341678). Past performance is not a reliable indicator of future performance. While every effort has been taken to ensure that the assumptions on which the outlooks given in this publication are based on reasonable data, the outlooks may be based on incorrect assumptions or may not take into account known or unknown risk and uncertainties. Material contained in this publication is an overview or summary only and it should not be considered a comprehensive statement on any matter nor relied upon as such. The information and any advice in this publication do not take into account your personal objectives, financial situation or needs. Therefore you should consider its appropriateness having regard to these factors before acting on it. While the information contained in this publication is based on information obtained from sources believed to be reliable, it has not been independently verified. To the maximum extent permitted by law: (a) no guarantee, representation or warranty is given that any information or advice in this publication is complete, accurate, up-to-date or fit for any purpose; and (b) Financial Decisions nor its employees are in any way liable to you (including for negligence) in respect of any reliance upon such information or advice. December 2017
Contact: Financial Decisions PO Box 484 Mona Vale NSW 1660, T 02 9997 4647, F 02 9997 7407

